
The early days.
I relocated to the Bay Area in the spring of 2015 to start my new role at DoorDash headquarters, a former animal hospital in Palo Alto. My role was undefined, my roadmap unwritten, and my title had been changed in our HR system to “Swiss Army Knife” by one of the engineers. It was a joke, but it was also accurate.
As I wrote in Part 4, I called the function BizOps after reading Dan Yoo’s description of similar teams at Yahoo and LinkedIn. The idea resonated immediately: generalists dropped into ambiguous business problems, figuring out what was going on, solving what they could, and then handing things off once the work became more repeatable.
That was exactly what DoorDash needed at the time. I did not set out to build an Analytics function. I was trying to answer the most important questions the business had, one at a time.
I had no formal background in analytics. No statistics degree, no data science training, and no SQL skills when I started. That didn’t matter; I just started.
The first thing I did was ask for all the data we had on business performance. Most of it sat with Finance and had been compiled for fundraising purposes. We had a few dashboards in Chart.io, built by two ops managers who knew SQL.
I spent my first week doing what I could: dissecting cohort retention curves in Excel. An engineer would pull a CSV file with the raw data, and I’d manipulate it from there. INDEX MATCH was my best friend. It was inefficient—not as inefficient as VLOOKUP, but inefficient—and I knew it. But any time I wanted a different cut of data, it required going to an engineer. Even less efficient.
So I spent two weeks heads-down teaching myself SQL. I completed 3 online trainings (my favorite back then was the one written by Mode) and then moved on to real data. I challenged myself to rewrite the queries powering various Chartio dashboards to see if I could get the same answers. I wrote queries, pulled data, and checked whether the results matched. If they didn’t, I tried to debug on my own, and if I was completely stumped, I would sit down with the original authors for help.
Creating a source of truth.
Before we could set goals, we needed to understand our performance at a more granular level. I started setting up dashboards to track the basics: order volume, new consumer acquisition, cohort retention, merchant selection, delivery quality, unit economics, etc.
It sounds obvious now, but at the time, even getting everyone aligned on what we should measure was a meaningful step. I created the DoorDashboard, which we emailed to the whole company each morning so everyone could see the prior day’s performance. We were growing quickly, launching new markets, and learning in real time which inputs moved the business.
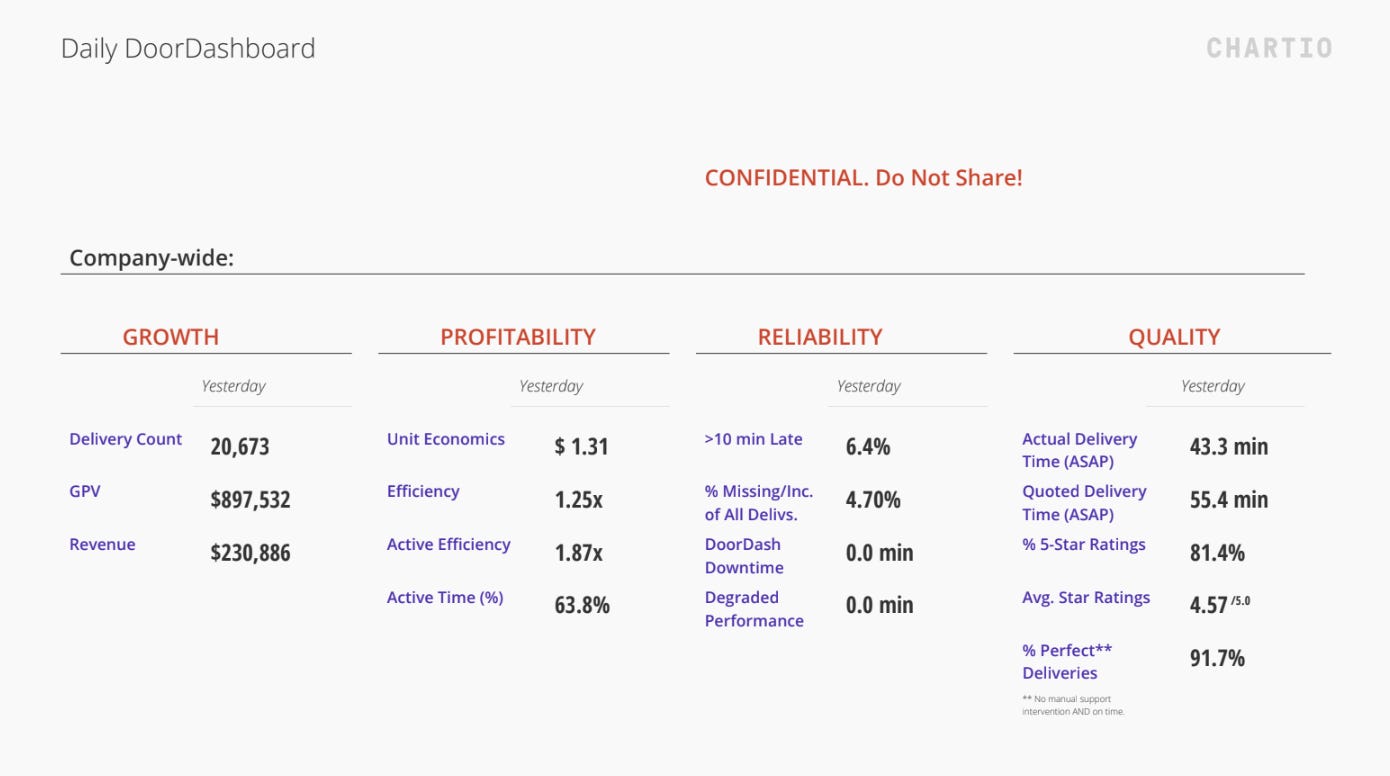
DoorDashboard in 2015. It was simple, but it gave everyone the same daily view of the business: growth, profitability, reliability, and quality.
But even with my (now) intermediate-level SQL, not all the data I wanted was accessible in our dashboarding tool. I still frequently required an engineer’s help. And one of our early engineers, Peter Tseng, believed in what I was trying to do and offered to help me help myself.
Peter was genuinely interested in data science and put together a small syllabus to teach me the basics of Python for data analysis. It was just enough to be dangerous, which was exactly what I needed.
He introduced me to pandas, NumPy, and seaborn. The first script I wrote pulled cohort retention by city and visualized it as a triangle heatmap in aqua. It was beautiful.
That was a real unlock. And yes, for anyone wondering: our Substack logo is a little homage to those early cohort heatmaps.
Once I could see the data the way I wanted to, I stopped asking what was happening and started asking why. Why was retention increasing in one city and declining in another? Was it affordability? Selection? Quality? The launch strategy? The consumer mix? I read through consumer feedback, looked at trends by segment, and began identifying themes.
Each insight generated new questions. Each question led to a new analysis. Each analysis created new metrics we needed to track. The cycle didn’t stop—and honestly, it still hasn’t.
Building from zero.
For a while, I was the entire Analytics team.
A typical week might involve setting goals for a new market launch in the morning, digging into consumer retention in the afternoon, and making sense of consumer complaint data at night. There was no roadmap. The roadmap was whatever problem seemed most important to the business that week. I was, as I said at the time, a one-woman Swiss Army Knife playing whack-a-mole with an endless supply of business questions. It worked for a while, until it didn’t.
I knew things had to change when the problems started outpacing me and my skills. We needed geo-level pay optimization for Dashers. We needed to understand density, supply, demand, and unit economics with more precision. We needed simulations. The questions were getting harder, and they required skills I simply did not have—especially deeper statistics and stronger technical depth.
So I started hiring—deliberately, and for complementary skills. My strategy was simple: hire people who could do things I could not. I did not want a team of people who looked exactly like me. I wanted people who spiked in different areas and made the team collectively stronger.
While our strengths were different, our mindset was remarkably similar: we were entrepreneurial, pragmatic, curious, and deeply committed to helping one another succeed.
Barrett had a background in computer science and much stronger Python skills. David had a background in statistics and experience with logistics networks. Ryan had strong SQL skills and a consultant’s approach to problem-solving. Preston brought depth in machine learning and a teacher’s mindset. Hiring people whose strengths complemented my own was one of the most important decisions I made.
Much of what I know about data science, I learned from my own team. I still believe that is one of the most underrated forms of professional development available to any leader: surround yourself with people who are excellent at things you are not, and be humble enough to learn from them.
For a while, we used our real problems as interview questions. The cohort retention SQL query—the one I had struggled to write myself—became our standard coding exercise. The selection intelligence model was used as a case study. If a problem was hard enough to teach us something about the business, it was probably useful for understanding how a candidate thought. I’ll write more about hiring in future posts, but this was the beginning of my philosophy.
That was how the team grew: one business problem, one skill gap, one hire at a time.
When the team outgrew me.
In the early days, people came to us with questions, and we answered them. That worked when the company was small and everyone knew everyone. The first few people on Analytics each had their own reputations. The work spoke for itself.
But as DoorDash grew, the stakes got higher. That model wouldn’t scale.
As we got bigger, analysis started happening outside our team—by operators, by finance, by product managers. Some of it was good. Some of it wasn’t. I remember several instances of analysis reaching leadership that sounded confident but didn’t hold up under scrutiny. That was a problem. Bad analysis could lead to bad decisions. We needed a higher and more consistent bar. That was when I started to understand that Analytics could not just be a team that answered questions. We had to help define what good analysis looked like across the company.
The team shifted from a group of generalists dropped into whatever problem was most urgent to a set of more permanent business partners who could go deep on a particular part of the business. Instead of bouncing from problem to problem, people began developing real context in areas like Dasher supply, consumer retention, merchant selection, and customer support.
We stopped being the team that answered questions and started being the team that owned outcomes alongside our business partners. Those relationships changed the work. People stopped coming to us only when they needed data. They started coming to us when they needed a thought partner.
That shift did not happen because I announced it. It happened one project, one recommendation, and one hard conversation at a time.
However, not every structure we tried worked.
At one point, we experimented with separating product analytics and business analytics, one supporting PMs and the other supporting GMs. In theory, that made sense. Product teams and business teams often ask different types of questions. In practice, we ended up with two people working on similar problems simultaneously, each from a different angle. So we rethought the structure and created a single analytics role that had to bridge both. It was messy for a while. But as our partner teams became more aligned on our north star goals, it started to work.
We had a similar approach to our team structure as we did with our product culture: test and iterate. We would build what the business needed, and then, as the company changed, we had to ask whether the structure still made sense. Sometimes the answer was no.
More teams reporting to you does not automatically mean you are more important.
This was a hard lesson, one that took longer to fully absorb.
In the early days, when I saw a gap, I built the thing to fill it. Data Engineering, Business Intelligence, Machine Learning, Data Product, and Experimentation—at different points—all got started within the Analytics team because the business needed them, and someone had to get them going.
That was the right thing to do at the time. But not every function we started was meant to stay.
I remember when our VP of Engineering came to me and said he thought Machine Learning Engineering (MLE) should move into Engineering. My first reaction was no. Not because I had a principled argument, but because it felt like losing something: team members, scope, and a piece of what I’d built.
I knew moving MLE into Engineering was the right decision for the company. It gave that team the right technical home, the right management structure, and the right path to scale. It also made me better at my job, because it freed me to focus on what I was uniquely positioned to do. But it took me longer than I’d like to admit to fully internalize that lesson: more headcount does not automatically mean more impact.
Sometimes, giving something up is exactly what allows both the work and the leader to improve. I’ve tried to carry that lesson forward every time I’ve faced a similar decision since.
Analytics became more than a team of problem-solvers.
We started as generalists, jumping into whatever problem mattered most. As DoorDash scaled, that wasn’t enough—we also needed a consistent way to measure the business. Analytics became the company’s scorekeeper, defining metrics, building dashboards, and creating shared visibility into performance.
One important milestone was the creation of the Weekly Business Review (WBR). Early on, I pulled the data each week and assigned red, yellow, and green grades to each metric. It was a thankless job. Every leader thought their red should be yellow, and every yellow deserved to be green. But the exercise forced the organization to answer fundamental questions: What are we trying to achieve? How will we measure it? What does success actually look like?
While that brought discipline, it wasn’t the right long-term relationship between Analytics and the business. Being the company’s scorekeeper positioned us as the referee—evaluating performance after decisions had already been made.
Analytics earned a reputation across the company for sound judgment and the ability to solve hard problems. Even in our role as scorekeepers, people knew we cared about impact, not just accuracy. That credibility enabled the team’s next evolution and transformed how we worked with our cross-functional partners.
We stopped thinking of ourselves as the owners of the metrics and started acting as co-owners of the business problems. Instead of simply measuring outcomes, we helped define goals, shape strategy, pressure-test tradeoffs, and work alongside Product, Operations, and Engineering to achieve better results. Success was no longer something we reported on; it was something we helped create.
I remember Tony asking in meetings, “Has Analytics signed off on this?” That question stayed with me, not because it meant Analytics had veto power, but because it meant people believed the decision would be better if we were in the room.
That was when Analytics stopped being a collection of talented problem-solvers, or even the company’s scorekeeper, and became a true partner in building the business.
What I’d tell my earlier self.
If I could go back and talk to the younger version of myself, with no SQL skills, no team, no roadmap, and a “Swiss Army Knife” job title, I’d tell her this: do not let the absence of a credential, title, or prior experience stop you from trying.
Relevant experience matters less than you think. What matters is whether you are willing to figure things out and learn from the people around you.
I could not have articulated all of that in 2015. At the time, I was just treading water—trying to answer the next question, build the next dashboard, hire the next person, and identify the next problem.
But somewhere along the way, that undefined role became a career.
The path wasn’t linear, but it turns out the squiggly line was going somewhere after all.
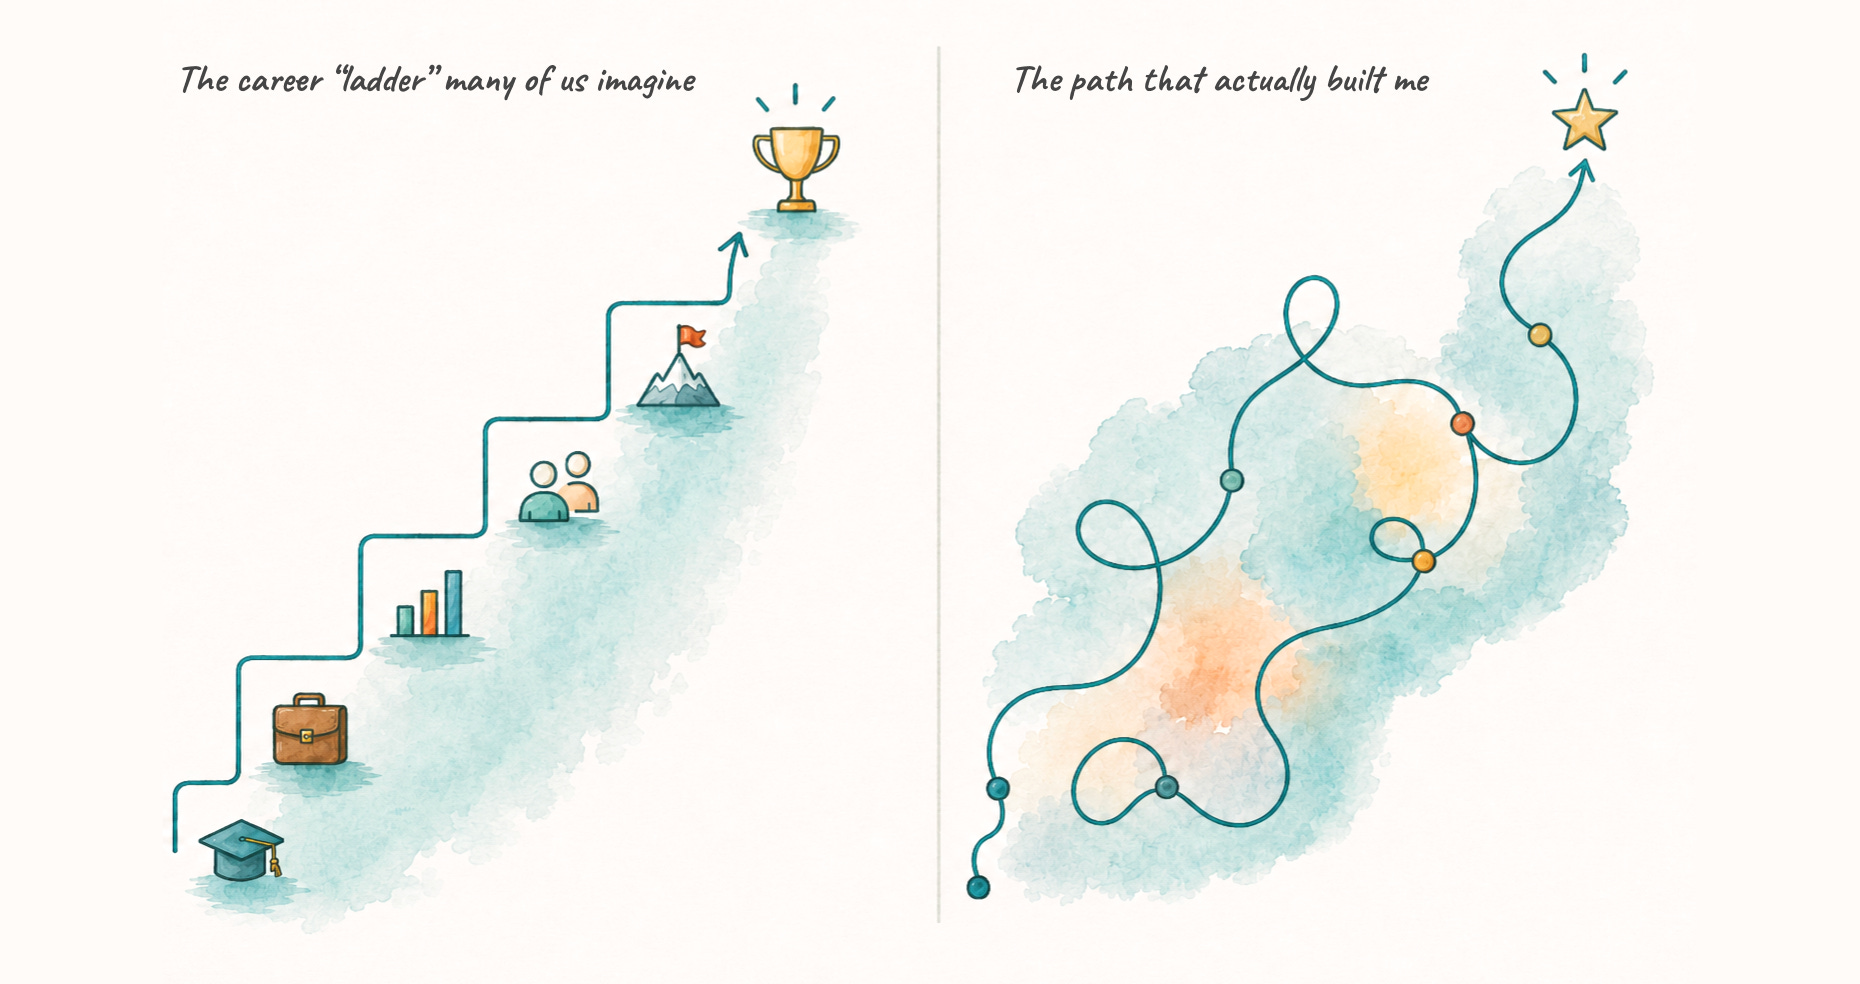
This brings my career journey series to a close. Not my career, hopefully, just the series.
In the coming months, I’ll be sharing a more practical series on what it takes to build and lead a world-class Analytics team—hiring, structure, culture, measurement, and the role of AI in all of it.
“do not let the absence of a credential, title, or prior experience stop you from trying”
Probably the toughest part when stepping into a new role. And it takes a lot of effort to reach this state of mind.
Looking forward to your next series in “DataRoom”.