
Building a World-Class Analytics Team (Part 3) - From Activity to Impact
Why Outputs Are the Wrong Scoreboard.
The scoreboard shapes the work
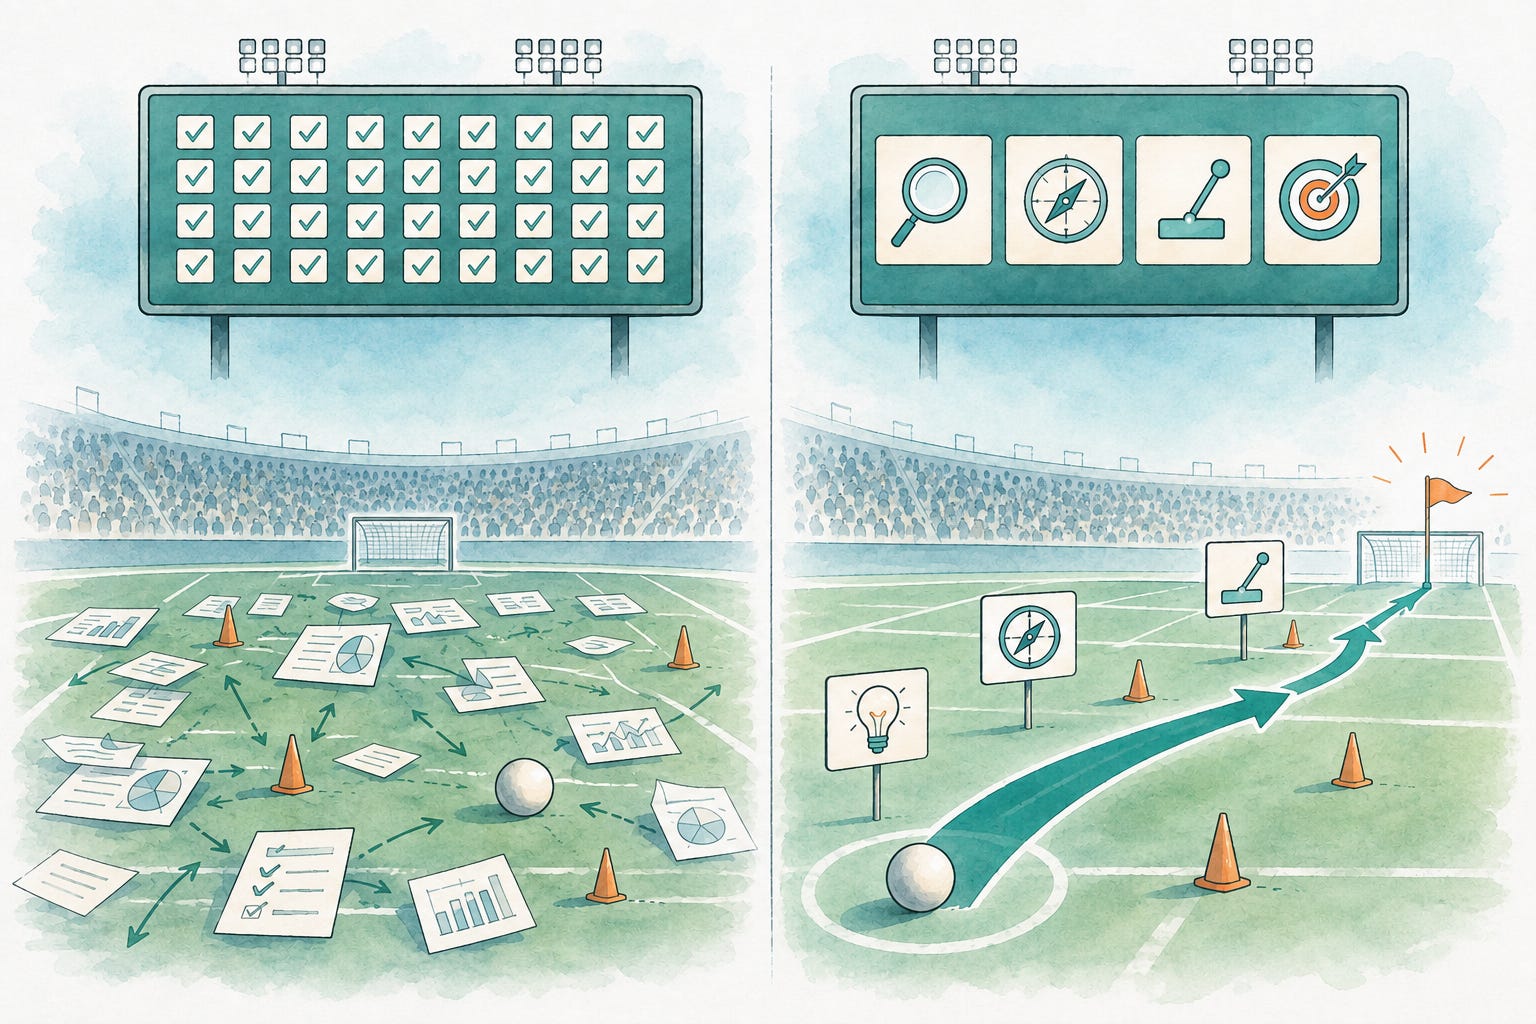
What a team measures eventually becomes what it optimizes for.
Many Analytics teams measure their work through activity:
Dashboards shipped
Tickets closed
Questions answered
Analyses completed
Those measures may be useful when a team is diagnosing a specific operational problem. They are not measures of value.
A team can complete more requests, build more dashboards, and answer questions faster without improving the business.
I have always believed that this is the wrong scoreboard.
If Analytics exists to help the business make better decisions and improve measurable outcomes, its scorecard should reflect that purpose.
At DoorDash, we did not define the value of Analytics by the volume of work the team produced. We focused on whether the work improved how the business understood a problem, made a decision, took action, or achieved an outcome.
I would rather see one piece of work change an important decision than twenty pieces of work be delivered and forgotten.
The question is not: “What did the team produce?”
It is: “What changed because of the work?”
The Analytics impact ladder
Not every project will have a clean, causally attributable business impact.
But every important project should be explicit about the type of impact it is intended to create and, where possible, estimate the size of the impact.
I evaluate Analytics impact across four levels.
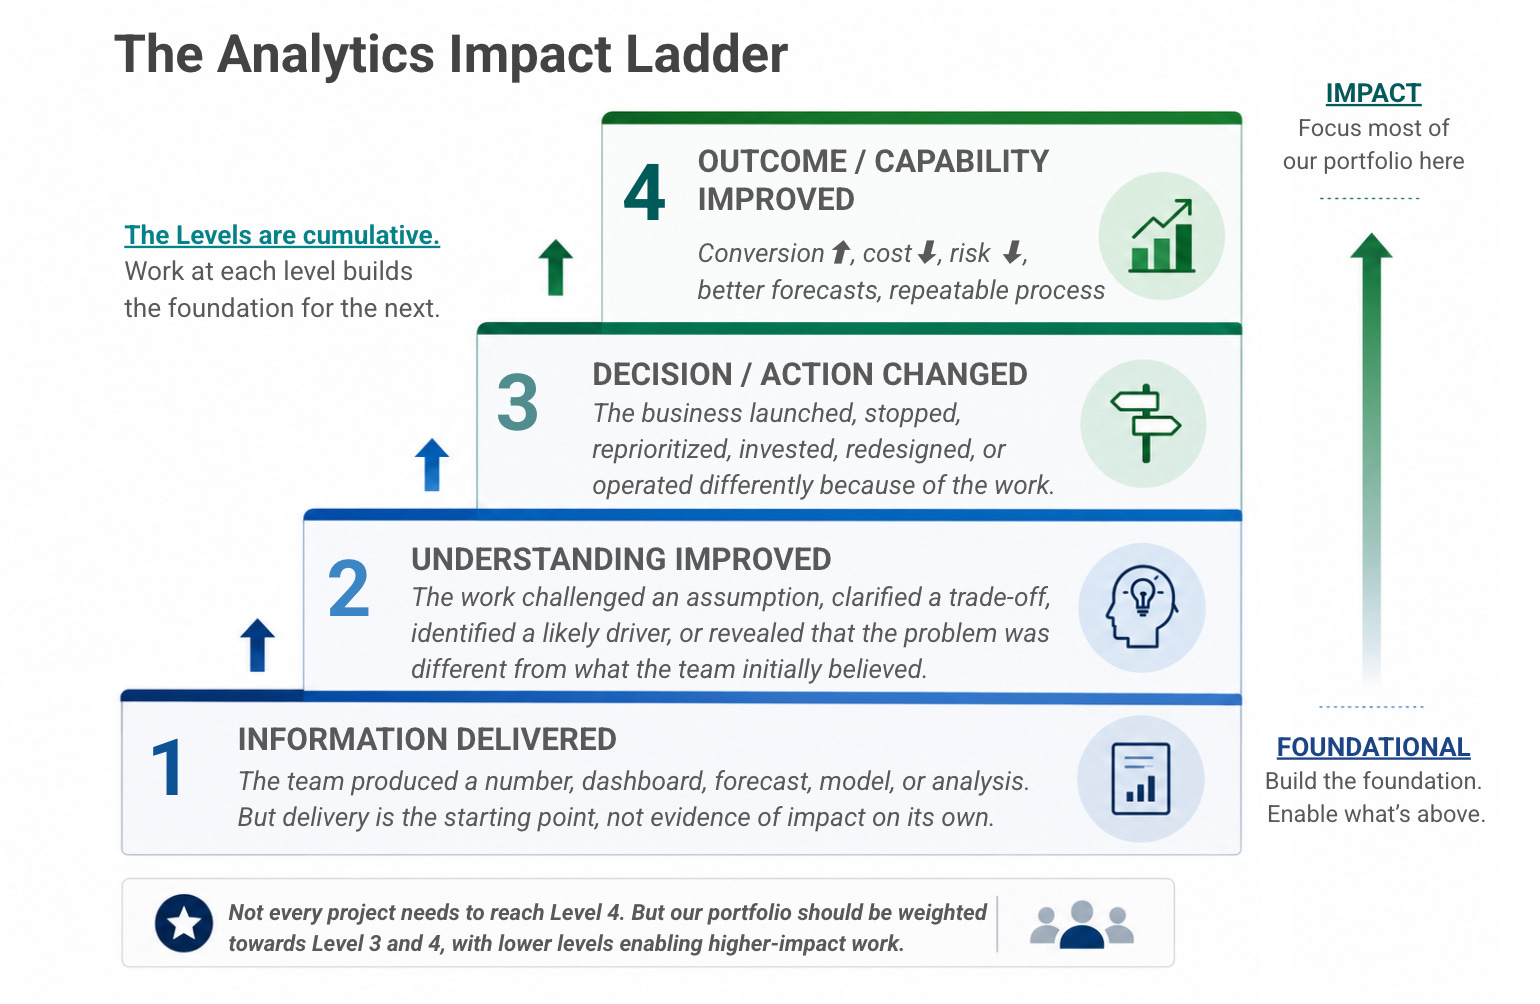
Level 1: Information was delivered
The team produced a number, dashboard, forecast, model, or analysis.
This work is often necessary. It creates the data foundation that makes higher-impact Analytics possible.
But delivery is the starting point, not evidence of impact on its own.
Level 2: Understanding improved
The work challenged an assumption, clarified a trade-off, identified a likely driver, or revealed that the problem was different from what the team initially believed.
The value is not simply the new information. It is the better understanding the organization can now use.
Level 3: A decision or action changed
The business launched, stopped, reprioritized, invested, redesigned, or operated differently because of the work.
The analysis did not simply inform the conversation. It changed what the team decided or did.
Level 4: An outcome or capability improved
The work contributed to a measurable business result or created a durable capability that improves future decisions.
This might include increasing conversion, reducing cost, preventing risk, improving forecast accuracy, or building a repeatable decision process.
This is where Analytics creates lasting leverage.
The levels are cumulative. The level reflects what the work ultimately changed, not the type of deliverable produced.
Not every project needs to reach Level 4. Foundational data, trusted metrics, and reliable reporting are essential, and some work will appropriately create value at Levels 1 or 2.
But the team’s overall portfolio should be weighted toward Levels 3 and 4. Lower-level work should clearly support higher-level decisions, actions, or capabilities.
For every important project, define the intended level of impact before the work begins. Then return to it afterward and assess what the work actually changed.
Define impact before the work begins
An impact-based measurement model starts before the analysis begins.
It changes how the goal is written.
Instead of:
Build a new performance dashboard.
Try:
Enable regional leaders to identify underperforming markets earlier, assign corrective actions, and determine whether those actions improved performance.
Instead of:
Analyze the customer-retention decline.
Try:
Identify the primary drivers of the retention decline and recommend which two interventions the team should prioritize next quarter.
The deliverable still matters, but it becomes part of the goal rather than the goal itself.
A strong Analytics goal identifies the decision, the decision owner, the action the work should enable, and the evidence that will show whether it worked.
Defining those elements upfront makes the work more focused and the eventual impact easier to assess.
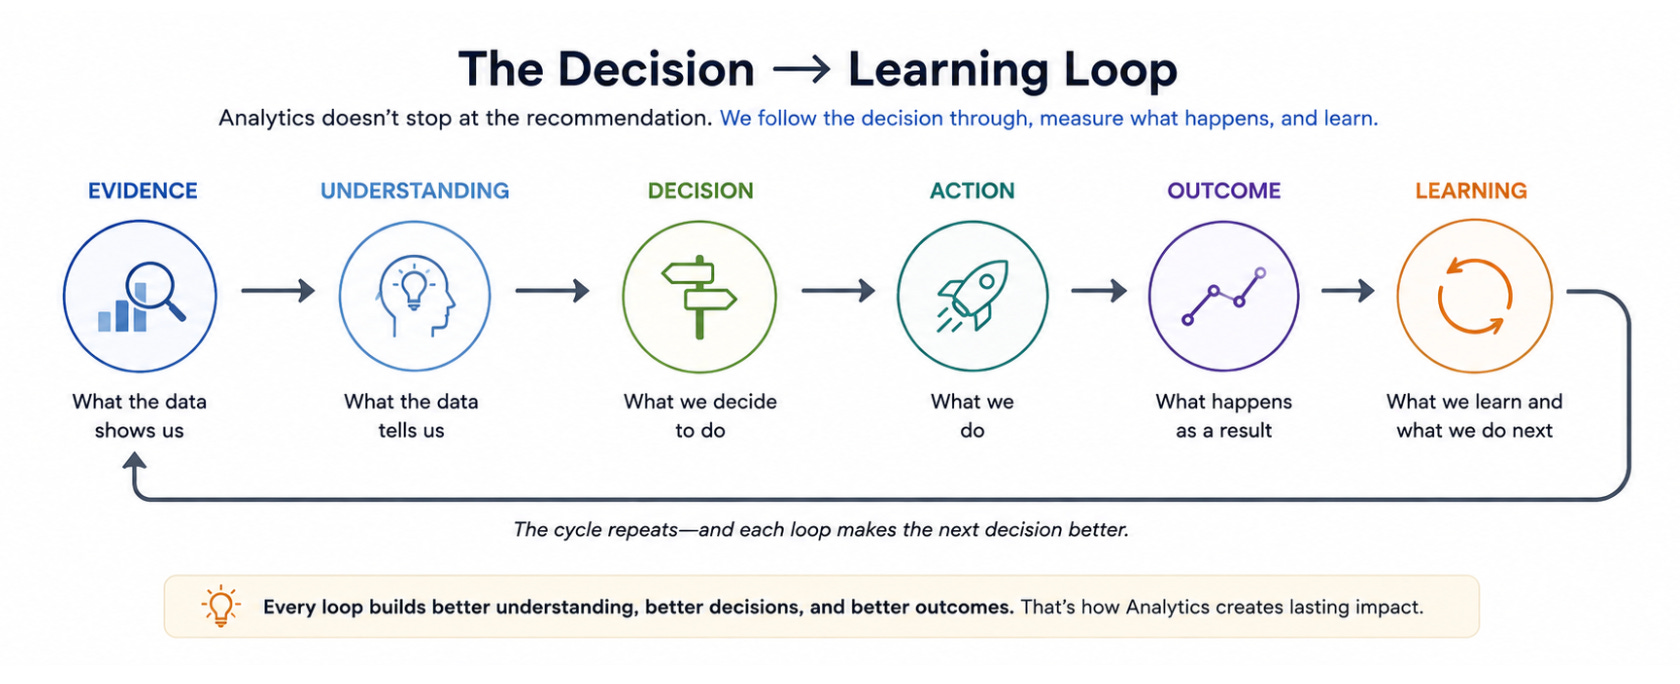
Following the decision through
Consider the market-launch example from Part 2.
The market was 12% below plan. The initial analysis showed that new-customer conversion was weaker than expected, while retention among customers who converted remained healthy.
The recommendation was to maintain the launch, pause further geographic expansion, and shift acquisition spend toward higher-intent channels.
Part 2 focused on reaching that recommendation.
Measuring impact requires following it through.
At the time of the decision, the team could define the intended change:
Decision: Should the business continue expanding the launch, change its approach, or pull back?
Understanding: The primary constraint appeared to be the quality of incoming traffic, not the product experience itself.
Action: Pause expansion and change the acquisition-channel mix.
Expected outcome: New-customer conversion should improve while retention remains healthy enough to support future expansion.
Next review: Return in four weeks to compare expected and actual results.
The impact of the work is not the analysis document or even the recommendation.
It is what happened afterward.
Did the business change its approach? Did conversion improve? Did retention remain healthy? Was the original diagnosis supported? What did we learn about our marketing channel efficiency and mix? Should expansion resume, or did another constraint prove more important?
The numbers are illustrative. The discipline is the point.
Analytics should define the intended change, help the business act, and return to understand what actually happened.
For a small number of important projects each quarter, repeat this exercise: define the intended change, compare it with what actually happened, and capture what should influence the next decision. At the team level, look for whether this pattern appears consistently across the portfolio.
Measuring impact in practice
I do not believe portfolio-level impact can be reduced to a single KPI.
I also would not give every individual a revenue target or require every analysis to claim direct causal credit for a business result.
Analytics work is collaborative. Its impact is often shared with Product, Operations, Engineering, Marketing, Finance, and other partners. It may also appear months after the original work is completed.
Pretending that attribution is cleaner than it is does not make the measurement more rigorous.
That does not mean we avoid measuring impact quantitatively.
We estimate the incremental impact of the actions our team helped influence across the portfolio. We then look at that impact relative to the size of the team and how it changes year over year.
The goal is not to assign each person a dollar amount of impact. It is to understand whether the team is becoming more leveraged over time.
Are we helping the business generate more incremental impact per person this year than we did last year?
That is an important measure of efficiency.
As an Analytics team grows it should not simply produce more work because it has more people. Over time, it should become better at identifying higher-leverage opportunities, influencing more consequential decisions, and generating more impact with each person.
But impact per person is only one dimension of how I would evaluate the team.
I evaluate the team’s portfolio by asking three questions:
1. Are we working on the right decisions?
The Analytics roadmap should be tied to the company’s highest-priority goals.
Look at how much capacity is aligned with those priorities, whether Analytics is involved before major solutions are chosen, and whether reactive demand is crowding out more important work.
The portfolio should reflect the priorities of the business, not just the order in which requests arrived.
2. Did the work improve the decision and the next one?
Look for projects where Analytics changed how the problem was defined, challenged an important assumption, shaped the recommendation, reduced ambiguity, or influenced the final action.
Then ask whether the team returned to compare expected and actual results, understand why they diverged, and apply that learning to the next decision.
The goal is not to claim sole ownership of the decision or prove that the original recommendation was right.
It is to understand where Analytics improved the quality of the decision and helped the organization make the next one better.
3. Did the resulting action create measurable impact or a durable capability?
Where possible, we use experiments, quasi-experiments, and other causal inference techniques to estimate incremental impact. Controlled experiments, natural experiments, and carefully designed observational analyses help distinguish what changed because of an intervention from what would likely have happened anyway.
We estimate the incremental impact of the business action, not the percentage of that impact claimed by Analytics. Outcomes are usually created through shared execution across teams.
At the team level, aggregating those impact estimates also gives us a way to understand whether our leverage is increasing over time. We can compare total incremental impact relative to team size year over year without pretending that any individual owns a specific portion of that impact.
When the intended result is a durable capability rather than a direct business outcome, impact should be evaluated differently. Look at whether the capability is adopted and repeatedly used, improves decision speed or consistency, or produces more accurate and reliable decisions over time.
Impact sizing is not solely a mechanism for proving the value of Analytics. It also helps the business by:
Ensuring we are making meaningful bets
Estimating incremental impact helps us understand whether the decisions we influence are large enough to matter.
It pushes the organization beyond work that is easy to complete or measure and toward opportunities capable of materially changing the trajectory of the business.
Creating accountability for outcomes, not just decisions
A good decision process is important, but it is not the end of the work.
We should set clear expectations for the impact an initiative is intended to create and return afterward to assess whether that impact was realized. We don’t want to celebrate simply shipping a feature. We want to celebrate shipping a feature that had a real business impact. Even when ownership is shared, this creates a stronger connection between the original decision, the quality of execution, and the result.
Improving planning and forecasting
Impact estimates are not only retrospective measures. They are also inputs into planning.
Understanding the expected incremental impact of initiatives helps the business forecast where it is likely to land, identify the gap to its goals, and determine whether its current portfolio of investments is sufficient to close it.
Over time, comparing expected and realized impact also improves the quality of future plans.
The goal is not perfect attribution. It is a credible estimate of incremental impact and a disciplined comparison between what we expected, what occurred, and what we learned.
Putting this into practice
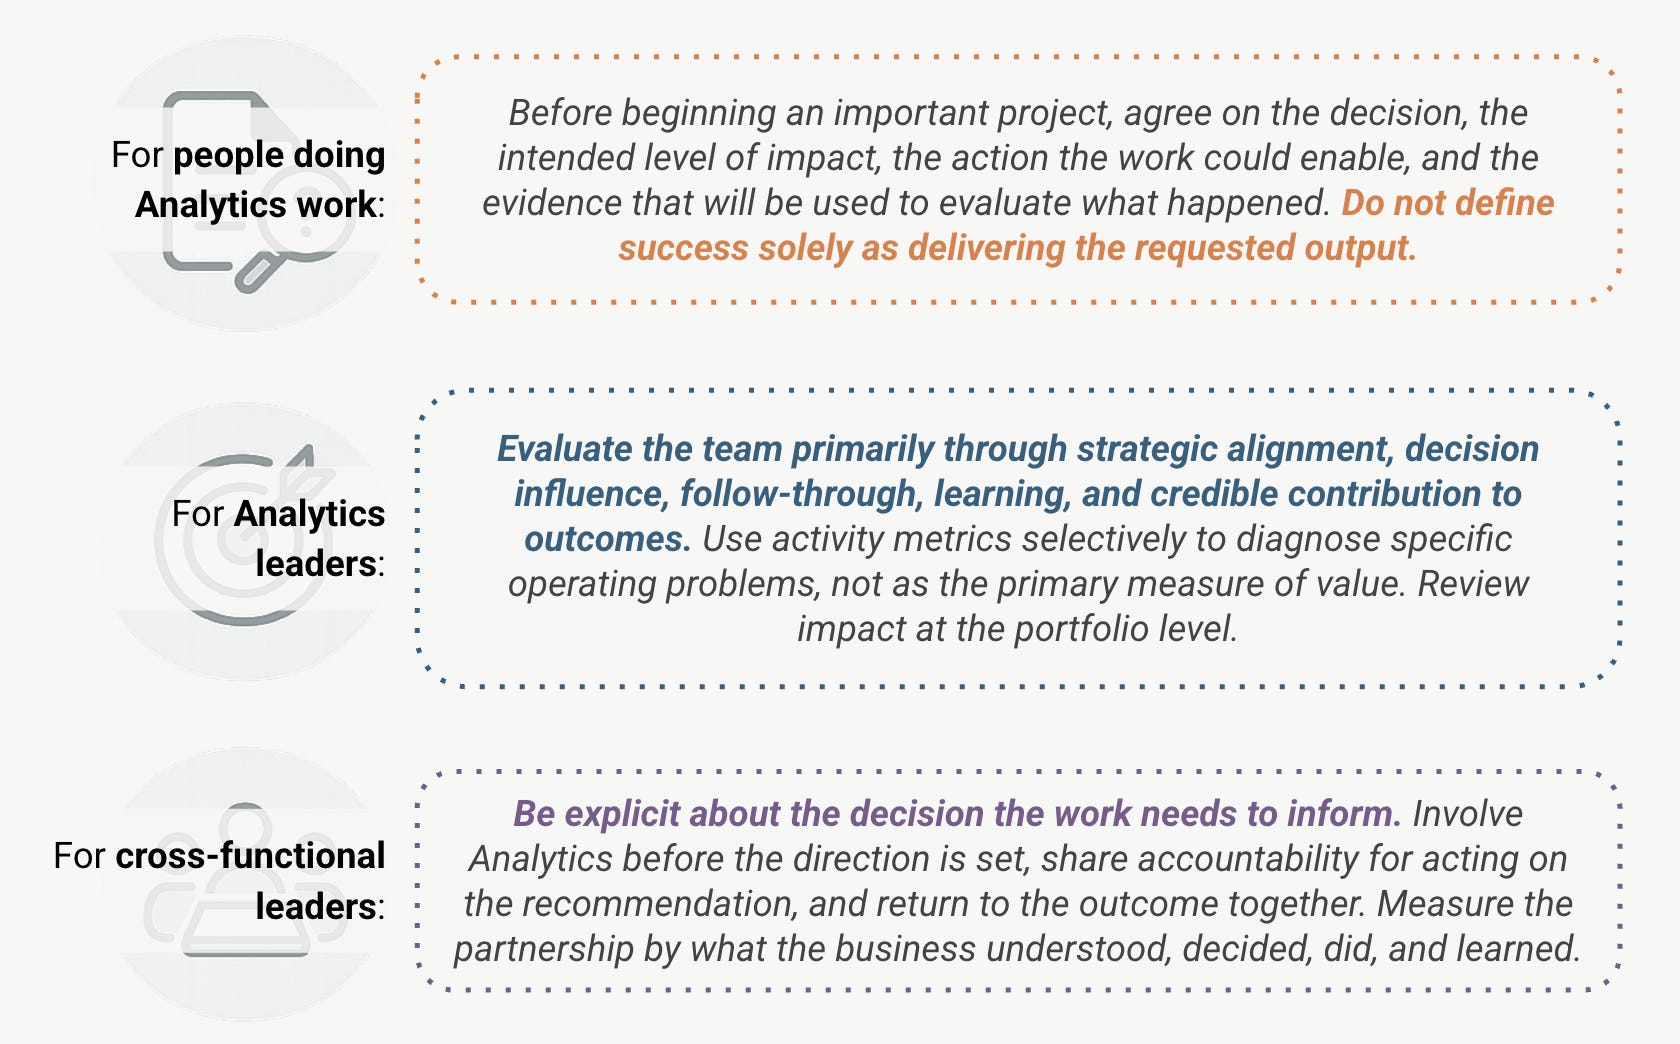
The bar
Analytics should not be measured by how much it produces.
It should be measured by what its work improved:
Better understanding.
Better decisions.
Better actions.
Stronger outcomes.
More durable decision capabilities.
Measure Analytics by what it changes, not how much it produces.
Acknowledgements: The ideas and writing are mine, but they’ve been shaped by current and former teammates who challenged my thinking and helped evolve how we built and ran the Analytics team. Special thanks to my Chief of Staff, Anita Chan, for brainstorming, editing, and AI wizardry on the images, and to ChatGPT and Claude for serving as editorial critics.